In the winter of 2024–25, we learned firsthand that a weak La Niña doesn’t necessarily deliver the cool and wet conditions that fuel the deep, mid-winter snowpacks we all hope for.
Before diving into this year’s outlook—how it compares, and what other predictors might carry weight—let’s revisit the El Niño–Southern Oscillation (ENSO), the cyclical fluctuation in tropical Pacific sea surface temperatures that shapes global weather patterns. ENSO cycles through three distinct phases: El Niño (warm), La Niña (cool), and Neutral conditions. So how do the October forecasts for mid-winter ENSO probabilities compare between this upcoming cool season and the most recent one? The distributions are strikingly similar, with only a subtle weakening of the La Niña signal for 2025–26. Both forecasts suggest the highest odds for cool-phase conditions during autumn and early winter.
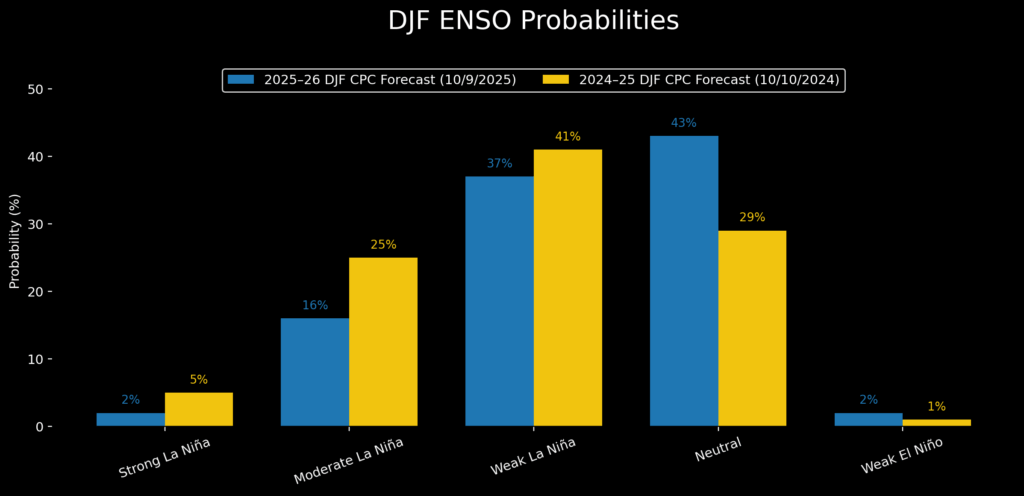
The Oceanic Niño Index (ONI) is based on sea surface temperature (SST) departures from average in the Niño 3.4 region, and is a principal measure for monitoring, assessing, and predicting ENSO. In the 2024-25 season, the December-January-February (DJF) ONI registered -0.6°C, barely nudging into weak La Niña territory. Moving to the present, the latest weekly SST departure of -0.6°C suggests that we’re once again on the cusp of a weak La Niña. The mid-October Oceanic SST models suggest a November minimum ONI of around -0.8°C with values decreasing to approximately -0.3°C by midwinter (DJF). This makes neutral ENSO conditions the most likely outcome for our mid-winter snowpacks.
With that context in mind, we can explore how Pacific Northwest mountain snowpack typically responds to ENSO phase strength using our updated Snowpack Climatology Dataset.
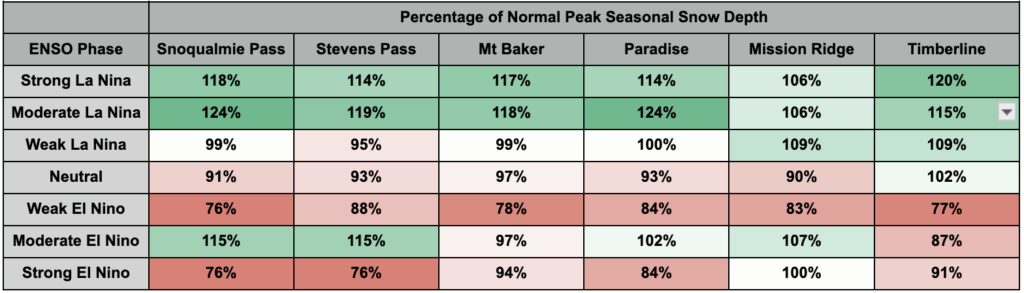
In weak La Niña winters, most stations hover near average snowpack levels, with only Mission Ridge and Timberline showing modest gains. It’s the moderate and strong La Niña years that clearly favor the west slopes and crest of the Cascades, producing peak snow depths 6-24% above normal. Neutral years typically yield slightly below-average snowpack across the region, while most El Niño conditions tilt the odds strongly toward reduced snowfall.
The long tails of the DJF distribution of forecast ENSO probabilities for the upcoming winter—18% chance of moderate/strong La Niña and 2% chance of El Niño—yield the highest influence on the mean. To evaluate the most likely outcomes, we specifically examine the average of the four sites with the longest and most robust data records (Mt Baker, Stevens Pass, Snoqualmie Pass, and Paradise).
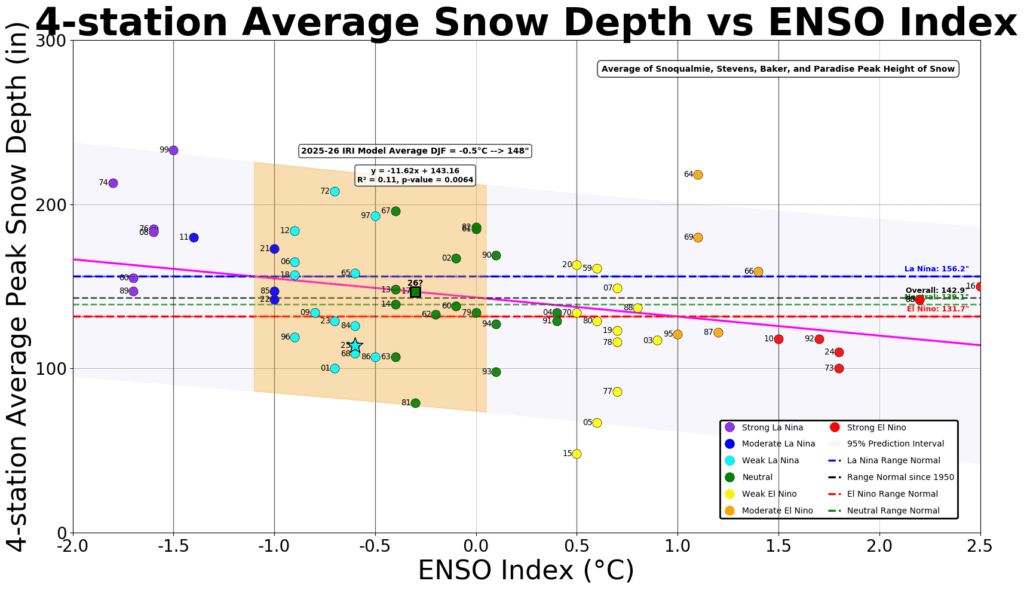
The 2024-25 season average peak snow depth of 114” was around the 19th percentile for data within the -1 to 0°C ENSO Index interval and was 24% below the regression trendline. The snowpack was reduced at lower elevation stations, most notably due to warmth. Longer-term climate trends may influence the analysis, so we can reduce their impact to some extent by viewing the above plot with only 21st-century data included. The shortened dataset lowers the mean snow depth x-y% across all ENSO phases. Even with this truncated dataset, the ENSO forecast predicts an almost perfectly “average” winter.
Linear best-fit trendlines explain 11% and 19% of the data variability for the ENSO vs Snowpack plots, including and excluding 20th-century data, respectively. Either way, over 80% of the season-to-season variability is not explained by ENSO. Various publications made headlines about a marine heatwave in September of this year, so it’s worth analyzing a time-series video comparing SSTs from September and October 2025 against 2024 and 2014. All three of these seasons had mostly positive anomalies. Slightly positive anomalies have become the norm as the long-term climate shifts faster than the 30-year average, but the deeper colors in the data deserve attention. Although a very weak El Niño, the 2014-15 season was marked by anomalously warm SSTs just off our coast, which scientists partially blame for this anomalously poor snow year. Our 4-station average snowpack reading languished at less than 50% of the 2024-25 season values. Although September 2025 began with very warm SSTs across the NE Pacific, these waters have cooled significantly, and our proximal waters are approaching normal.
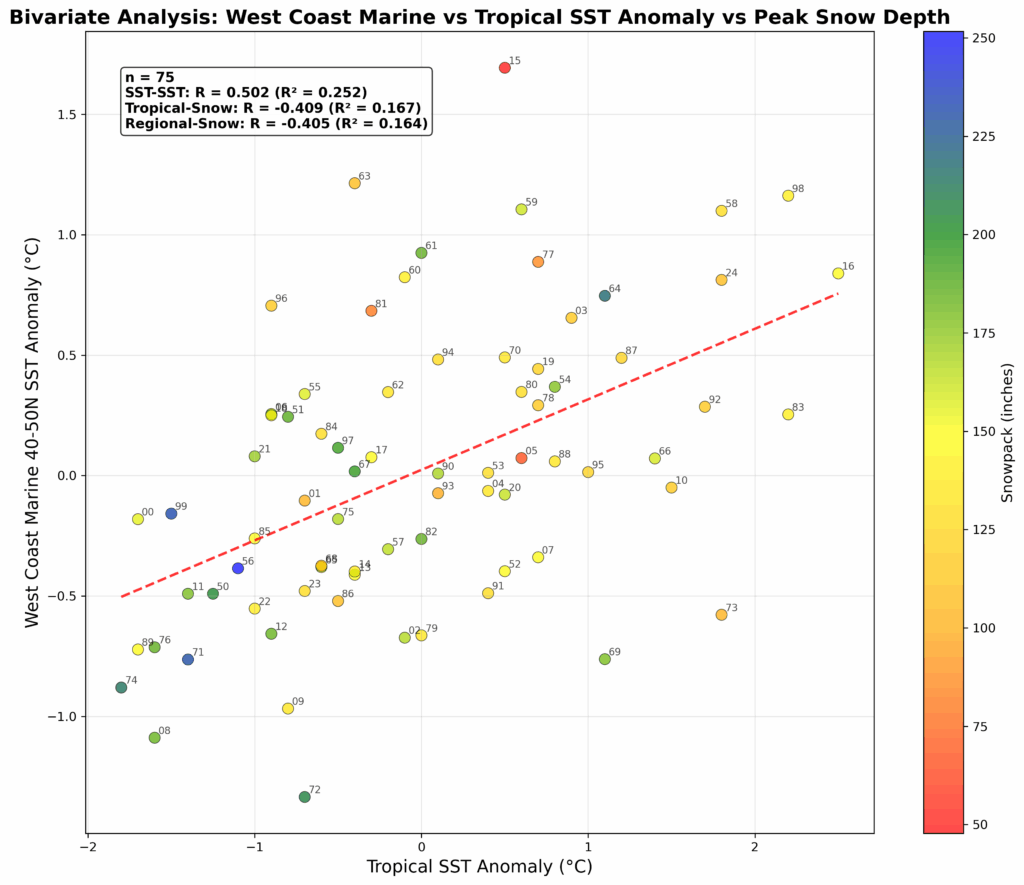
When we combine our proximal West Coast Marine waters (aka “The Blob”) with ENSO phase, we can explain 25% of the snowpack inter-seasonal variability. It will be worth watching the potential for an eastward spread of extraordinarily warm waters in the western North Pacific. As long as these extraordinarily warm waters remain west of Hawaii, we are locked into the negative phase of the Pacific Decadal Oscillation (PDO), which the State Climate Office notes correlates with cooler, snowier periods. A similar analysis of PDO vs ENSO phase explains 20% of the snowpack variance.
We don’t have any magic goggles for this impending ephemeral La Niña or neutral winter. At best, we can explain about 25% of the variability in our 75-year dataset using ENSO and regional Sea Surface Temperatures. An impending weak La Niña is likely to fade into neutral conditions by mid-winter, portending a fairly typical Pacific Northwest snowpack in our region. A moderate or strong La Niña remains a low probability, but if it occurs, would tilt the dice in favor of deeper snowpacks. Regional sea surface temperatures have cooled to near-normal levels, but surrounding warm waters may limit the potential for further cooling. So, we’ll all be rooting for sustained upwelling off South America and North America, continued cool-phase PDO conditions, and happy sardines and salmon.
__________
Disclaimers:
- The datasets are not fully quality-controlled.
- The impact of long-term climatic changes has not been fully incorporated into this study.