By Andy Harrington
Did you know that NWAC manages the largest automated weather station network of any avalanche institution in the United States?
These stations are located throughout our forecast zones, providing tabular and graphical weather and snowpack information to not only avalanche professionals, but to our entire community. Snow depth, precipitation, temperature, wind speed, and wind direction are the core measurements recorded. Other measurements are available depending on the station. Currently there are 50 stations in the NWAC network; 13 of these stations are managed and owned by WSDOT. Many of these stations date back to prehistoric times when phone lines and paper chart recorders roamed the earth. We have worked hard in recent years to upgrade our network and nowadays, you will find cell modems, radio relays, and fast ethernet connections delivering us almost real-time data about what is happening in the mountains.
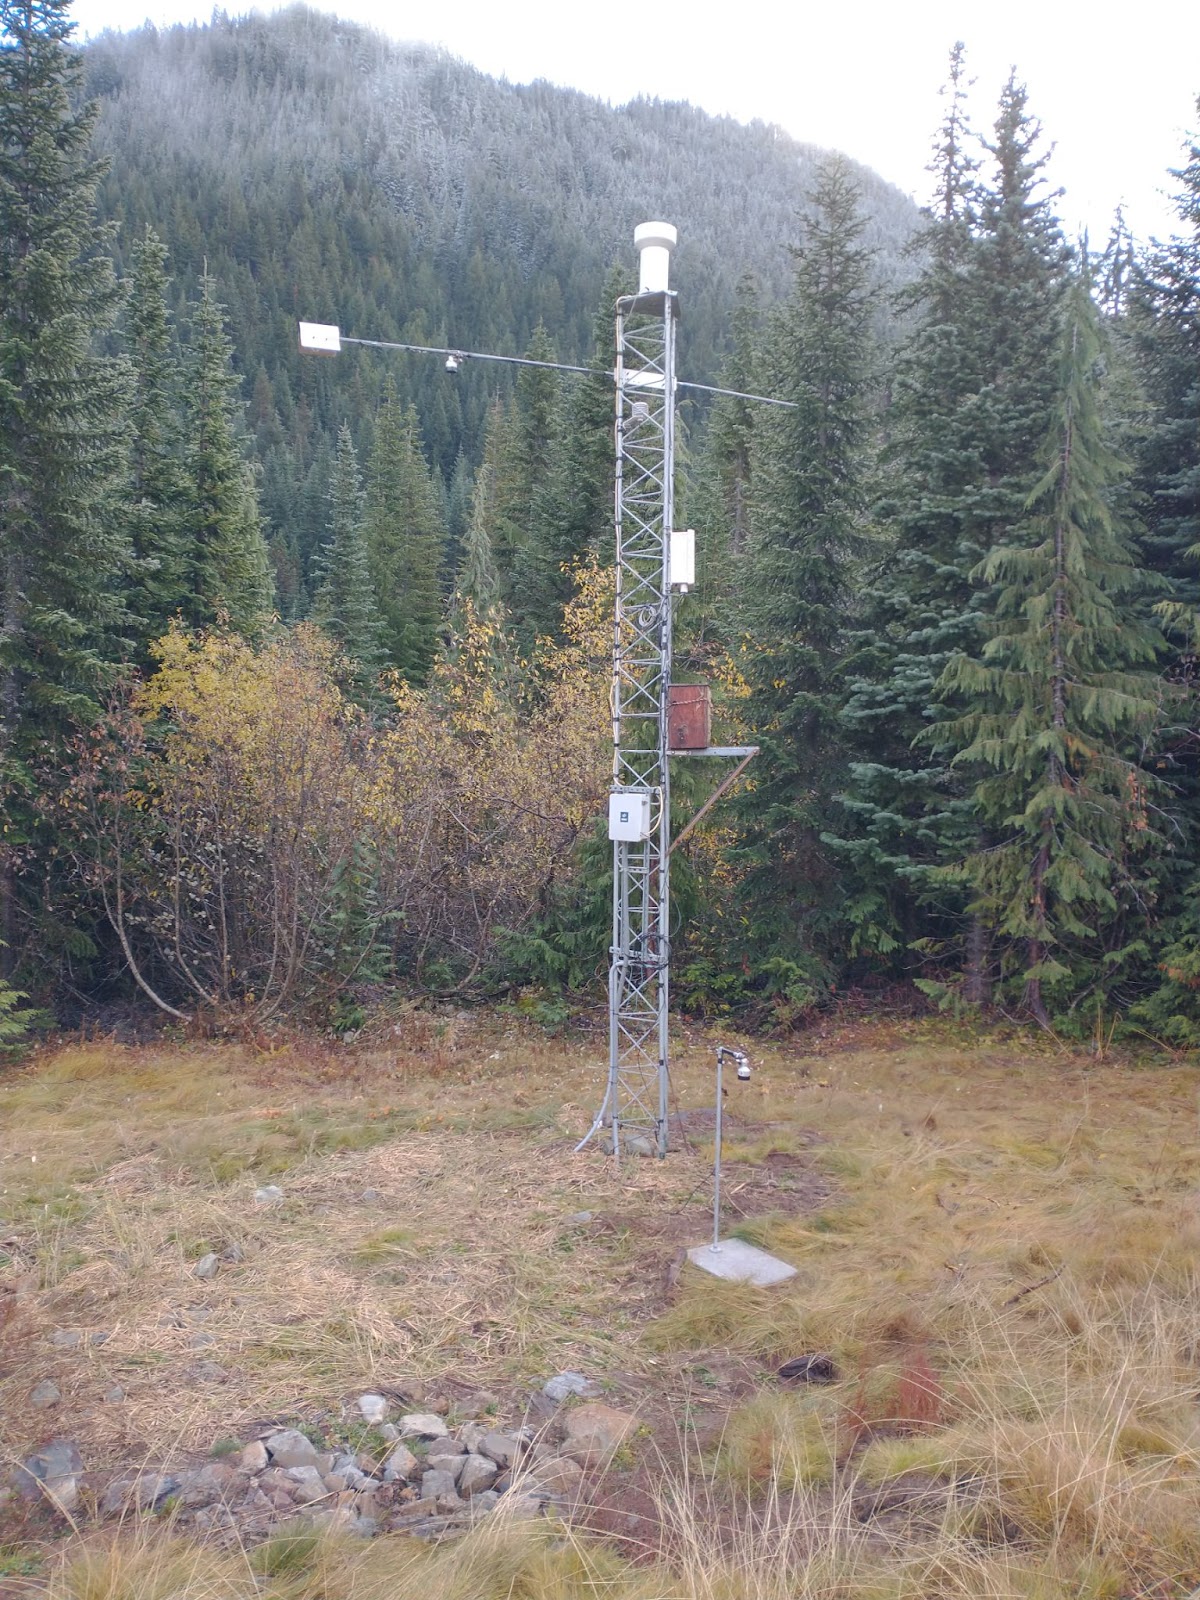
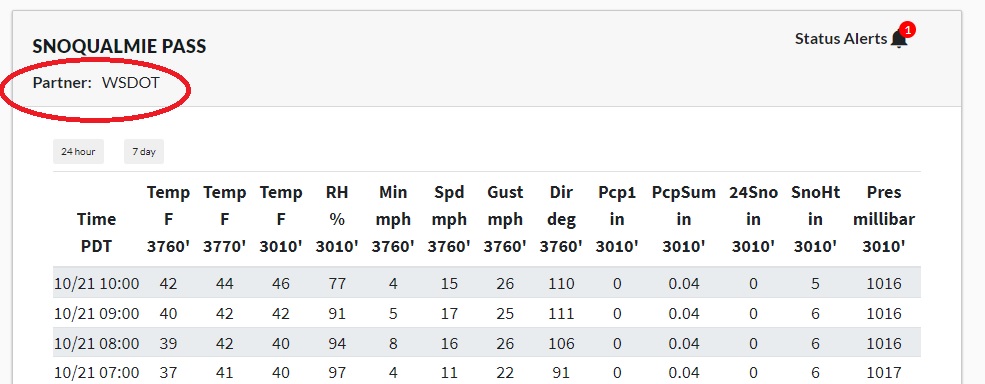
Running such an extensive network with expensive and precise equipment is a tall order, and it certainly takes a village. These instruments live in harsh environments and can fail or give erroneous readings as they plug along day in, day out. NWAC utilizes the shoulder seasons to perform the bulk of the maintenance and upgrades these stations require to be functional for the next winter season. During the winter months, time becomes more scarce as NWAC focuses on forecast operations. We begin to rely heavily on our partners including WSDOT, ski resorts, and the National Park Service, among others, to help manage the network and keep the data flowing. We here at NWAC are few, but our partners are many and they can often respond to outages faster than we can. Sometimes this involves a partner who is physically near a site rebooting the station for us, or installing a replacement piece of equipment that we have mailed to them. If you’re curious, our primary partner for each weather station can be found on our website when you look at your favorite station’s table.
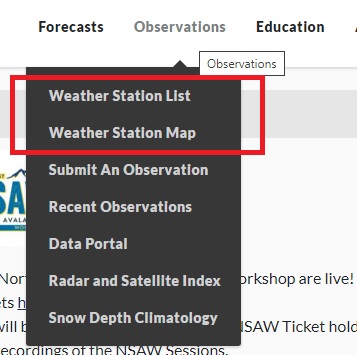
Now, some folks may just see a bunch of numbers when you look at the weather station data. That’s ok, because that’s all it is! It takes practice to figure out how these numbers relate to what you may actually see when you enter the mountains. You can start by finding the station closest to where you want to recreate by using the weather station map or the list of station tables.
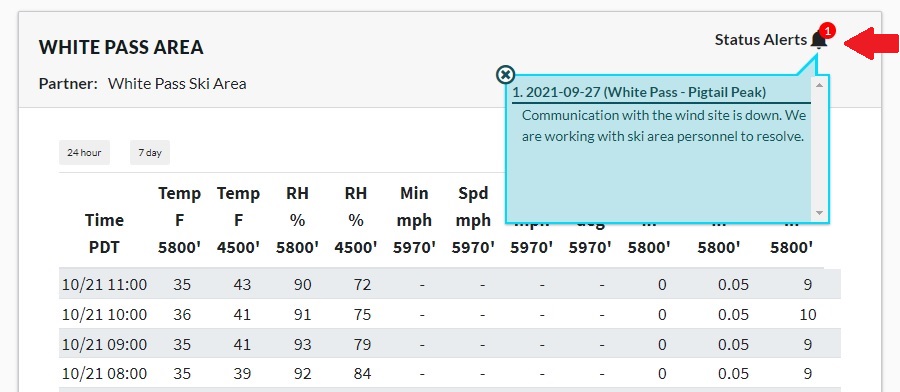
Our network is organized into 30 tables where you can find raw data aimed at helping with your decision making. Some stations will contain notes about the station or any known outages. These can help you better understand the station and data. To access the notes, click on the bell in the upper right corner of the table page. A number in a red circle will indicate how many notes there are for that particular station.
Once you’ve found a station near where you are recreating, there are a million ways you can use this data and our related tools to help with your decision making or trip planning. If you’re still new to it, start slowly by looking at familiar readings such as temperature or snow depth. When you head out for the day, take note of the temperature and how much snow has piled up wherever you are, then try to relate that back to what you see in the data. Maybe your spot is a little more exposed to the wind compared to the location of the station, causing a discrepancy in the amount of snow you expected. Remember this for next time you head out to that location. Once you feel comfortable with a few readings, slowly add in other measurements such as wind, precipitation, or relative humidity and then compare those readings to what you see in the field. Over time, your relationship with the data will become more familiar and eventually you will be able to build a picture of the mountains before you even walk out the door, hopefully leading to better terrain selection and decision making.
